 With P272 bringing more businesses into half hourly metering, there will be a huge increase in data. Used in the right way it is a powerful tool for better energy management, says STC Energy’s Alan Little in this sponsored article.
With the introduction of P272 in April this year, what are businesses going to do with all the extra data from their newly classified half-hourly (HH) meters? HH meters will provide businesses with electricity consumption data every half hour, which means having much more data than you’ve ever had before. For some this valuable data will vanish into a black hole. However, what if you could utilise this data to spot wastage, create reports and set budgets and targets?

P272 is the industry name of the mandatory regulatory change for electricity meters in profile classes 05-08 (often called Max Demand Meters) that affects over 100,000 UK businesses.
Businesses with 05-08 meters will have them automatically read every half hour, giving your supplier your actual consumption from more than 17,500 reads per year. As such, your bill will become more accurate but also a lot more complicated and new charges may appear. In addition, businesses must also appoint a Data Collector (DC) to provide HH profile data and a Meter Operator (MOP) to maintain the meter.
Don’t let your current supplier take control of this and appoint their own default DC and MOP agents. You can make your own arrangements, and almost certainly save money on these annual fees.
Profile Alerts – If you can’t see it you can’t save it
Are businesses analysing and utilising this added data to their advantage?
The data coming in from your HH meters can be used to benchmark your usage against other similar sites, enabling you to spot wastage. But how can you do this?
STC Energy’s Profile Alerts are a successful way to analyse your electricity usage, helping you to reduce consumption and save on costs. They are also an effective way to combat energy waste. By analysing your sites’ historic consumption, our profile data software can form a picture of usage. This enables us to set accurate targets for each meter. These sites can then be automatically monitored for exceptions.
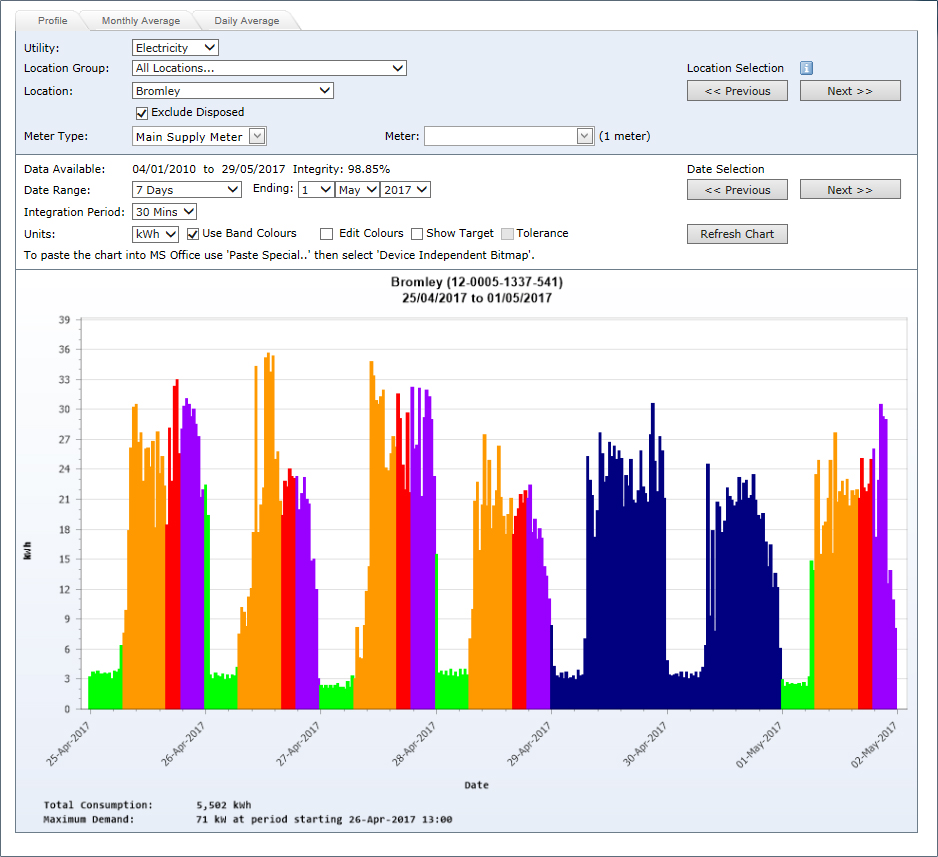
The Profile Viewer below shows the HH data for a particular site with targets set to show when consumption goes over. Any deviations found will trigger an email alert to a nominated site contact and/or can be viewed on an online map-based site exception dashboard. Alerts can also be directed to and monitored by our dedicated team who will then inform the customer of the over use. This report automatically highlights sites that are over target, allowing for fast corrective action.

Profile alerts are very successful in identifying energy wastage directly and in suggesting behavioural changes that can be implemented to reduce consumption. Profile alerts work for both small and large multi-sites.
Due to the independent nature of STC’s systems, data from all providers can be monitored together. This ensures that if a customer changes supplier, consistent records are maintained.
DUoS – Distribution Use of System
DUoS charges, for use of the electricity distribution network, are paid by the end user to the supplier who then passes them on to the relevant Distribution Network Operator (DNO). DUoS charges only appear on energy-only contracts (pass-through contracts) as itemised charges. Fully inclusive tariffs have these charges built into the unit price.

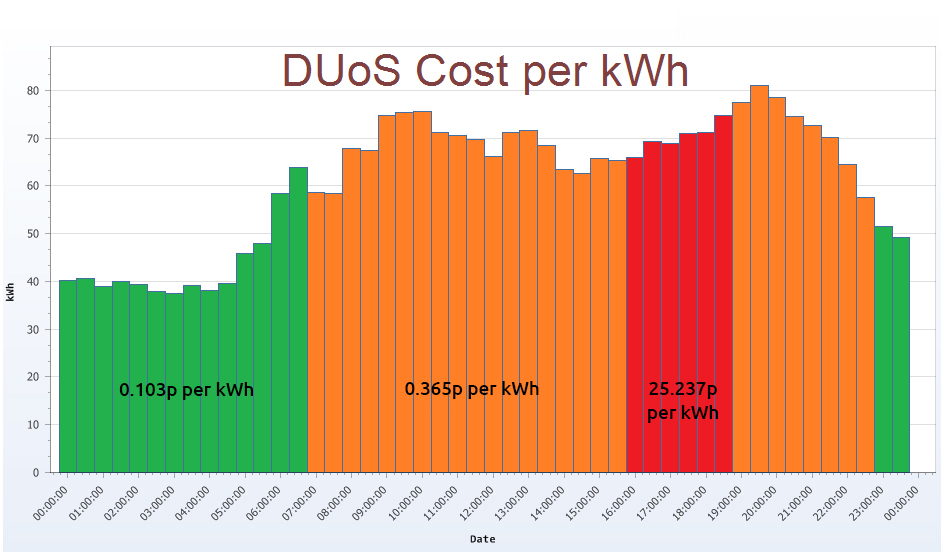
During the week certain times of day are considered peak times and are categorised as Red Bands. Other times during the day are categorised as Amber (daytime) or Green (night time). Amber and Green Bands are much cheaper compared to Red Bands, with Amber Band charges being higher than the Green Band.
This structure means you will pay more if you use electricity at peak times. Analysing your half-hourly data in this way can therefore help you save money by avoiding usage during peak times. So don’t let your data go to waste, after all you are paying for it.
- If you would like to analyse your data and spot wastage, create reports and set budgets and targets call Alan Little on 0208 466 2915 or email alan.little@stcenergy.com
Related articles:
PPI for utility bills: How to recover the millions firms are due from suppliers


